Rail Break Prediction ProjectUniversity Industry Placement+
Predicting rail breaks is a rare-event machine learning problem. This project focused on handling class imbalance, selecting meaningful sensor features, building Databricks-based ML pipelines, and evaluating performance with metrics suited to imbalanced data such as F1 and PR-AUC.
Problem Statement+
The goal was to predict whether a rail section may break within the next 30 days using operational and sensor data. The dataset was highly imbalanced, meaning standard classifiers could easily bias toward the majority non-break class.
Methodology+
- •Performed EDA on class distribution, location-level imbalance, and temporal break trends.
- •Researched feature selection methods including correlation filtering, variance thresholding, ANOVA F-test, Lasso logistic regression, and Random Forest feature importance.
- •Built feature engineering and model training workflows using Databricks notebooks, PySpark, SQL, and project pipelines.
- •Evaluated models using accuracy, F1 score, PR-AUC, and practical model interpretation for stakeholder reporting.
Results+
- •Improved model accuracy from 38% to 82%.
- •Increased F1 score from 0% to 60%.
- •Improved PR-AUC from 10% to 55%.
- •Reduced pipeline runtime by approximately 40% through PySpark and SQL optimisation.
- •Presented EDA insights and model findings to engineering and operations stakeholders.
Visualisations+
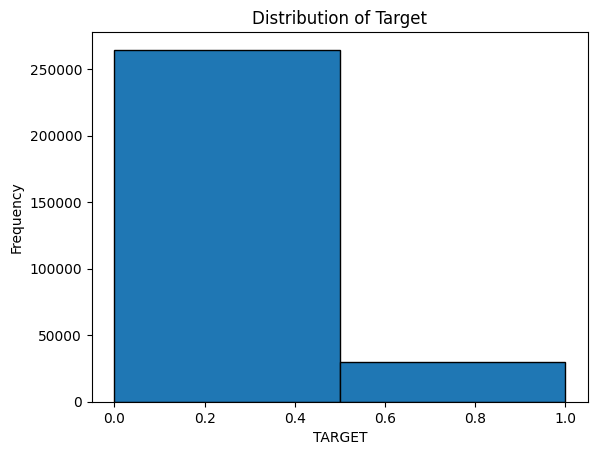
Target Distribution
The dataset showed a strong class imbalance, making F1 and PR-AUC more useful than accuracy alone.
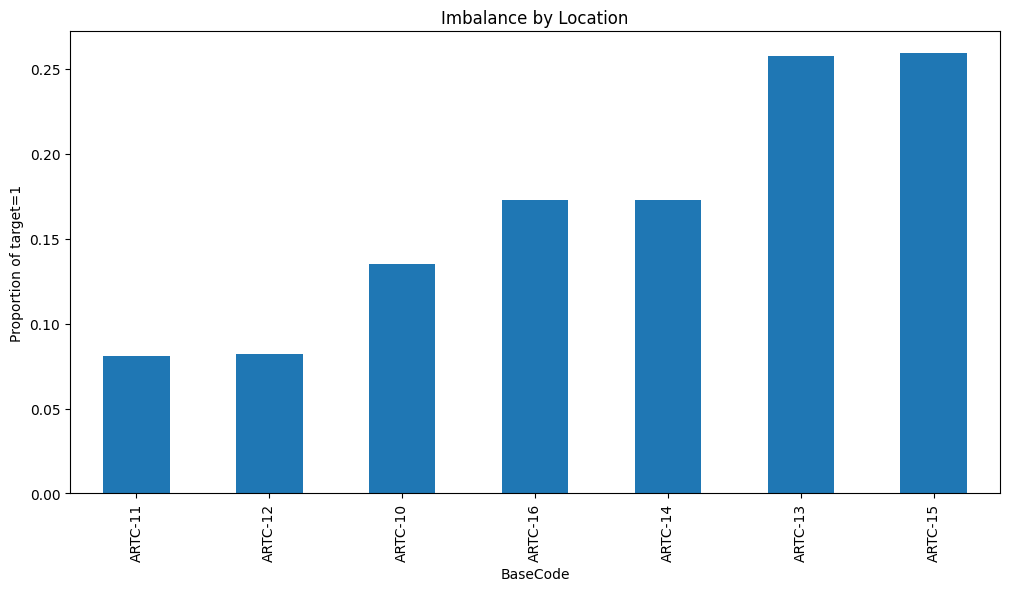
Imbalance by Location
Failure likelihood varied by location, showing that risk was not evenly distributed across rail sections.
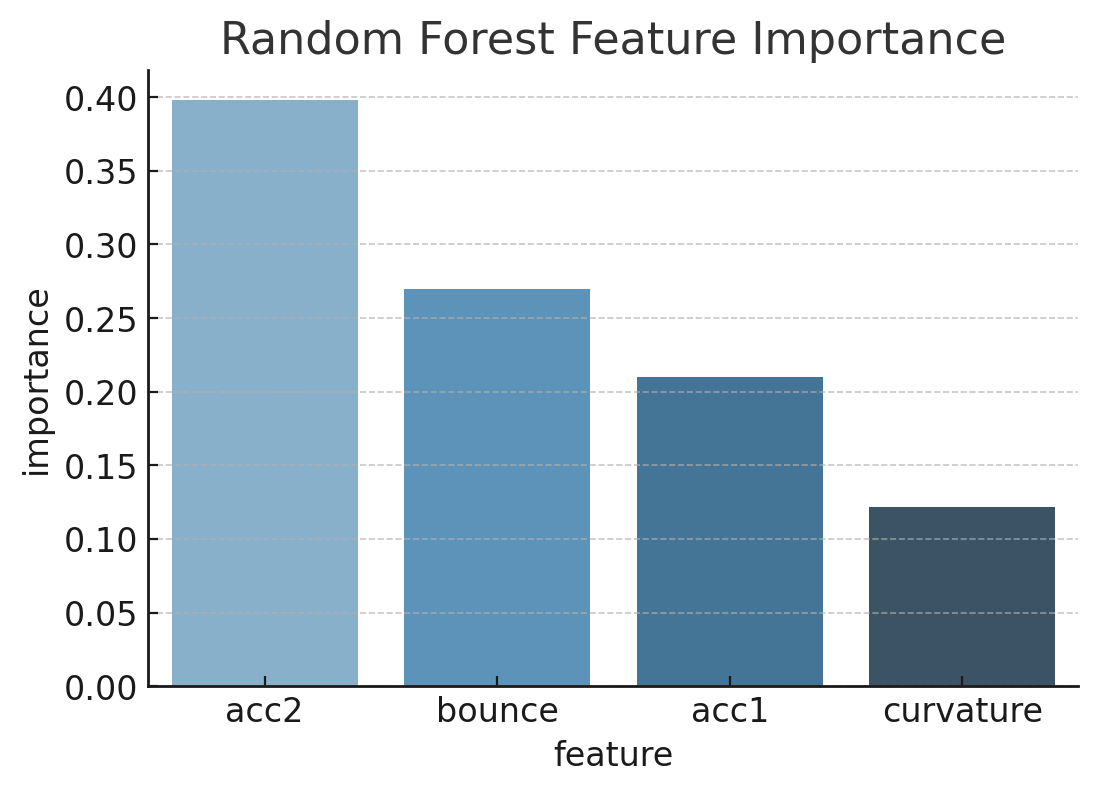
Random Forest Feature Importance
Tree-based feature importance helped identify meaningful sensor and operational predictors.
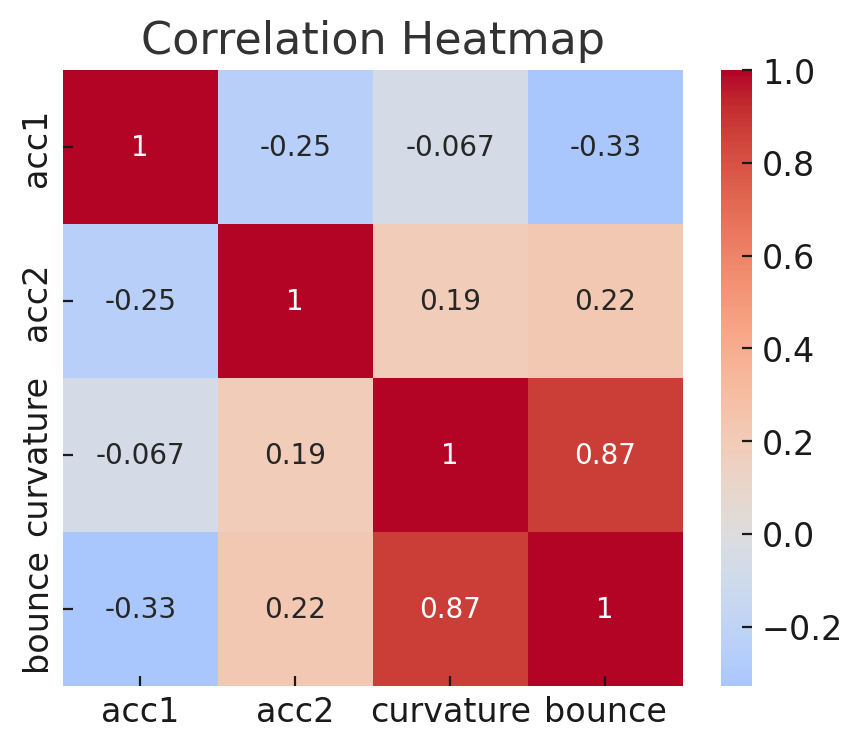
Correlation Heatmap
Correlation analysis was used to identify redundant features and reduce multicollinearity.